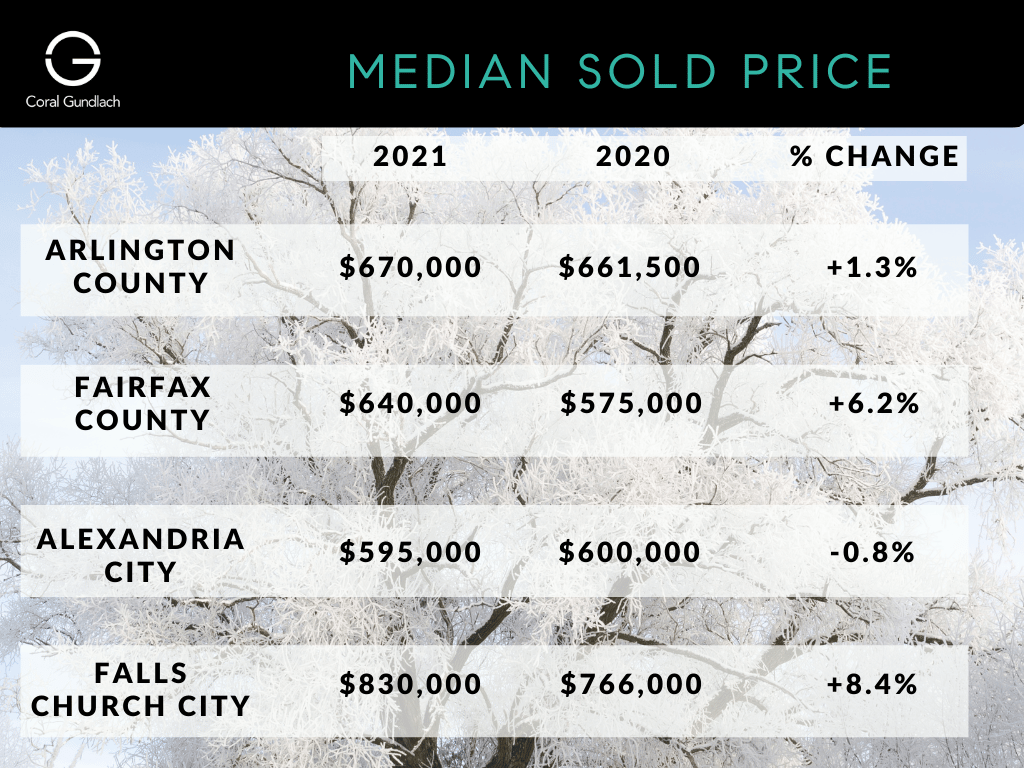
The Northern Virginia real estate market numbers for all of 2021 are now available. I’m giving a snapshot of the Arlington County, Fairfax County, Alexandria City, and Falls Church City statistics for median sold price, sold listings, and average list-to-sale ratio for 2021 and comparing it to 2020. These numbers really don’t reflect how low the inventory is currently. The inventory right now in January 2022 is the lowest it has ever been, even though 2021 was also incredibly low.
If you’re looking for specific info on an area in NOVA, want to buy but not sure if now is the time, want to sell but also unsure where to go if you do? Give me a call/text.
2021 Median Sold Price
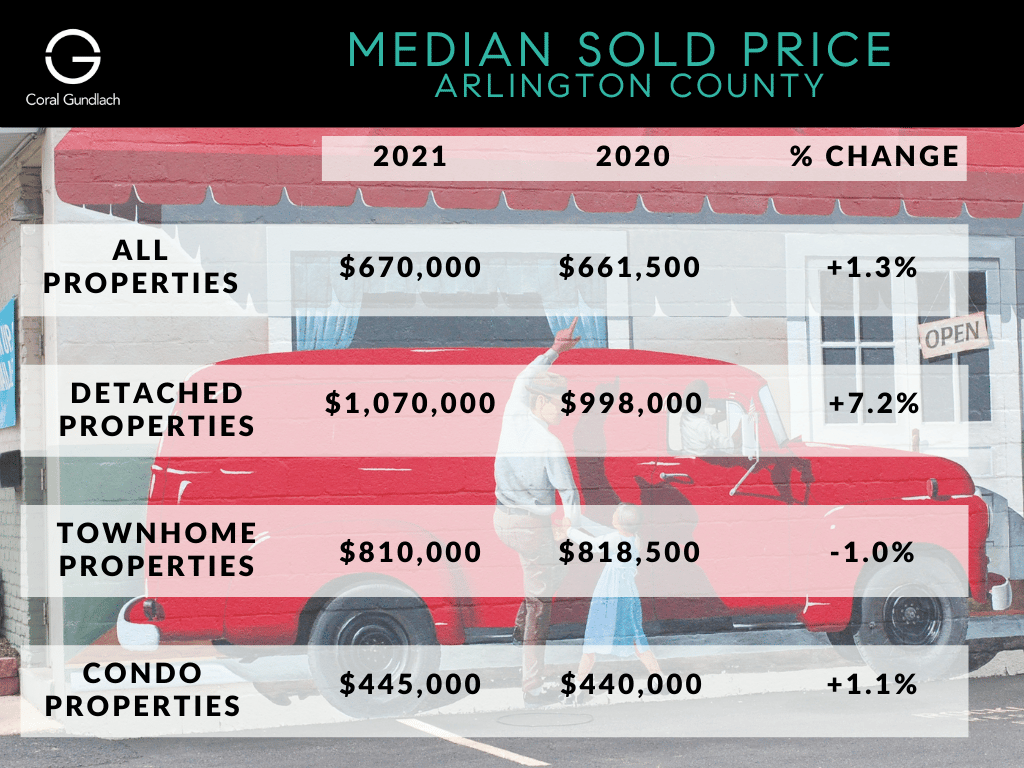
When I was looking at the numbers, I found they’re not really reflective of what we feel in the marketplace right now. These stats are a year’s worth of data and frankly super old at this point. There are many problems with averages and medians; they can be wildly skewed by a couple of anomalies and vary drastically day to day, week to week, month to month. For example, the Jefferson in Arlington, which is a 55+/assisted living condo building, really skews Arlington numbers to be lower than they really are. The prices there are incredibly low, but they charge astronomical monthly fees (some as high as 10k a month) to live there, which makes them a very difficult sell for many people and a very niche market.
Even one unusual listing that sells for drastically under list price can throw everything off. All that said, since I was sure the Arlington County representation was not accurate of what real life is like, we broke out the Arlington County median sold numbers by property types – detached, townhouse, and condos. Makes it slightly better.
But, as I wrote before, it changes so fast, so if you want to be in the market, get in touch with me now to get in the flow of the actual market, and get a lead on what’s coming soon too!
Data Source: Bright MLS. Statistics calculated January 06, 2022.
2021 Total Sold Listings
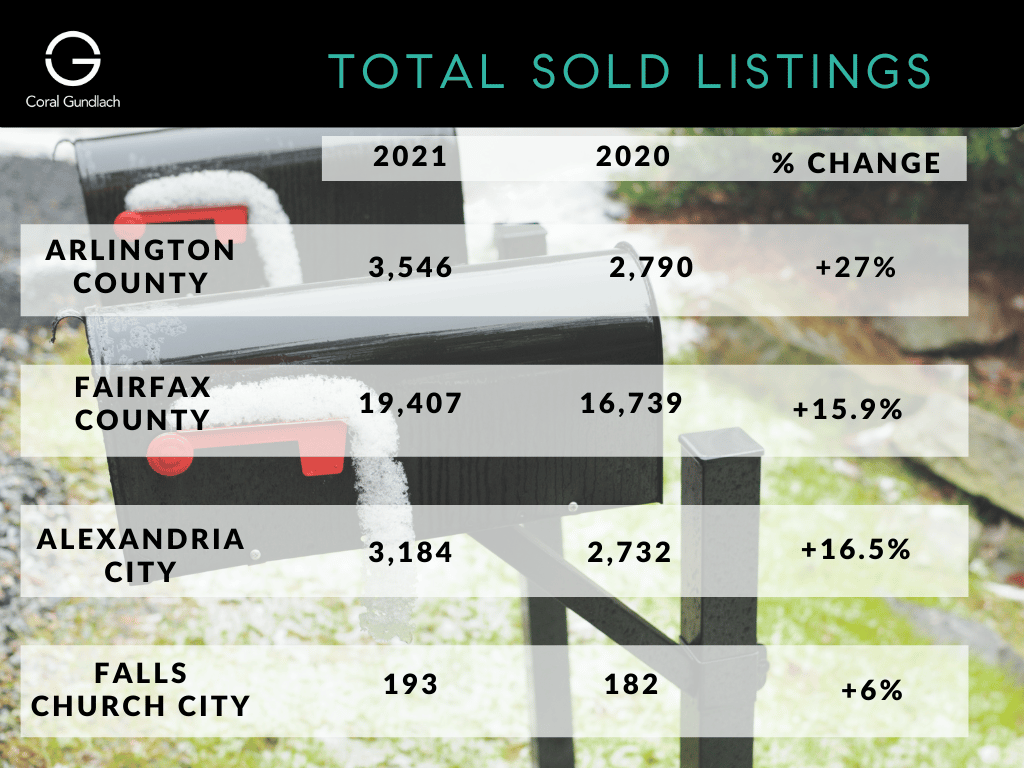
Data Source: Bright MLS. Statistics calculated January 06, 2022.
2021 Average List to Sale Ratios
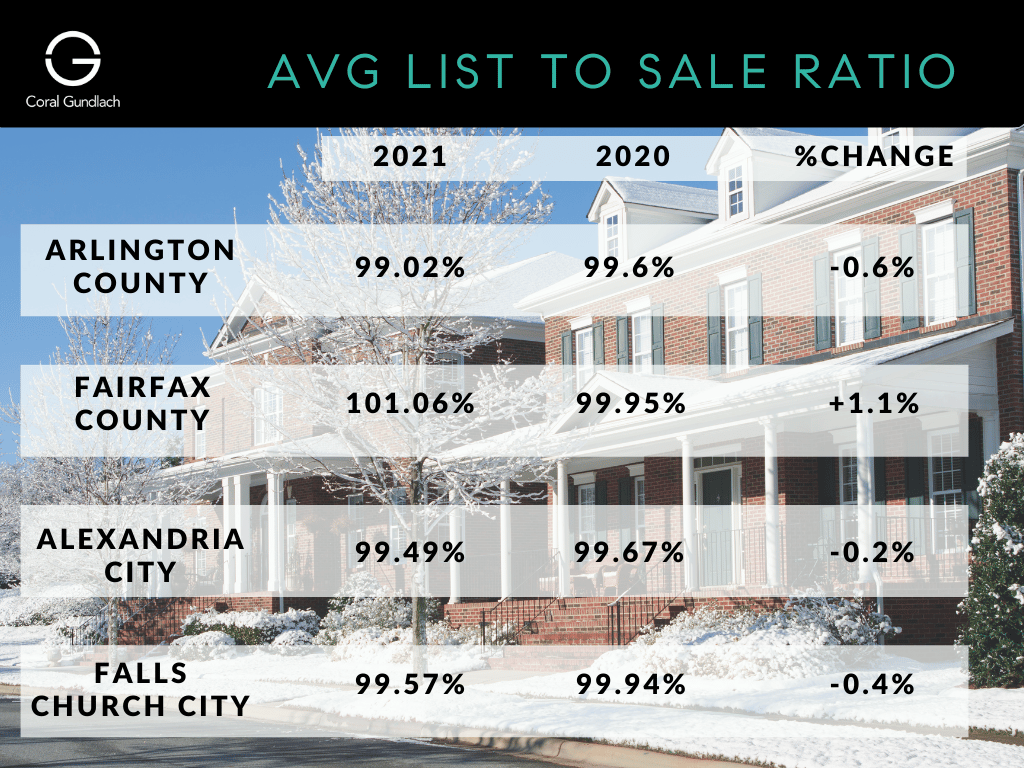
Data Source: Bright MLS. Statistics calculated January 06, 2022.